Introduction
Introduction to Problem
Speaker recognition is to recognize persons from their voice. No two individuals sound identical because their vocal tract shapes, larynx sizes, other parts of their voice production organs, manner of speaking including the use of a particular accent, rhythm, in tonation style, pronunciation pattern and choice of vocabulary are different. State-of-the-art speaker recognition systems use number of these features in parallel, attempting to cover different aspects and employing them in complementary ways to achieve more accurate recognition.
Figure
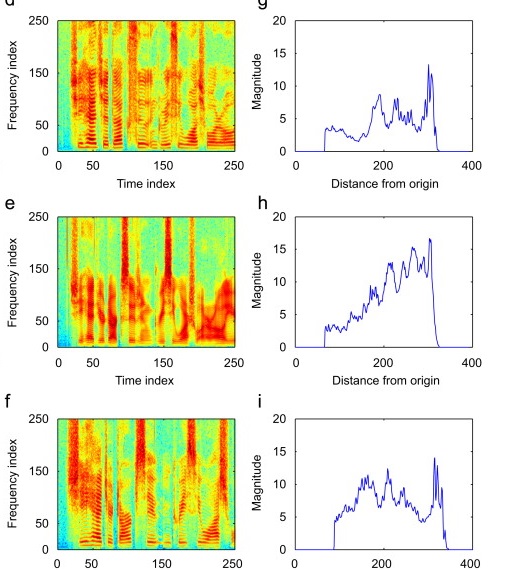
A sample (a) Spectrogram and its (b) Radon Transform in one chosen direction of three different speakers.
Proposed Approach
Voice Activity Detection
This is the pre-filter applied for all signals. There are two methods:
1.Energy Based Method: Filters out intervals with relatively low energy but is sensitive to noise.
2.Long-Term Spectral Divergence: Compare long term spectral envelope with noise spectrum. This is more Robust to noise.
Speech Spectogram
It is well known that the speech signal is non-stationary in nature. However, it is assumed that the speech signal remains stationary over a short duration of 20–30 ms. Hence, the pre-emphasized signal is segmented into M frames of 20 ms duration with a 10 ms overlap between two consecutive frames to retain a good quality of the signal and to avoid loss of information
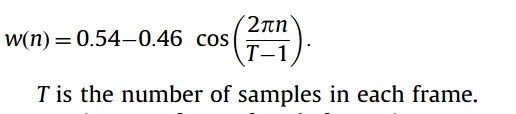
Windowing is carried out to reduce the edge effects at the beginning and the end of the frame. In our study Hamming window is multiplied with each frame
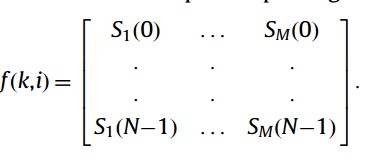
Fourier transform of each frame is computed to produce an estimate of the short-term frequency content of the signal, called as spectrogram. The spectrogram is the squared magnitude of the time-dependent Fourier transform versus time. N length DFT of a windowed frame is computed to obtain the power spectrum as below

where Xi(k) is the kth component of DFT of xi(n) (windowed frame). Re {.} and Im {.} indicate real and imaginary parts, respectively. The spectrums of these frames f(i,k) are concatenated to construct the speech spectrogram
In the proposed approach, the speech spectrogram is treated as an image. Contextual variations in speech images are similar to real-world changes in scene analysis. These variations can be captured by applying image processing techniques to these patterns.
Radon Transform
Radon transform is based on the parameterization of lines and the evaluation of integrals of an image along these lines. Due to inherent properties of Radon transform, it is a useful tool to capture the directional features of an image. Basically, the Radon transform adds up the pixel intensity values in the given image (spectrogram) or time frequency distribution along a straight line in a particular direction at a specific displacement

The spectrogram represents acoustic features like energy, pitch, fundamental frequency, formants and time in the form of a pattern.The Radon transform effectively captures these features in the pattern by projecting it onto different orientation slices.
The Radon projection is obtained by summing all the intensity values of those pixels that are within the circle surrounding the pattern to be recognized and on the line that is perpendicular to the ridge. For a given ridge, every pixel within the circle will be projected onto it along the perpendicular direction. This gives a rise to one Radon slice in the Radon domain. The proposed technique computes Radon projections of the spectrogram in different orientations
edundant information by the increased number of Radon projections. Hence in the subsequent experiments only seven Radon projections have been used [22.5, 45, 67.5, 90, 112.5, 135, 157.5].
Discrete Cosine Transform
DCT is a well-known signal analysis tool used in data compression due to its compact representation capability. It has an excellent energy compaction property for highly correlated data. This helps in reduction of the feature vector dimension.
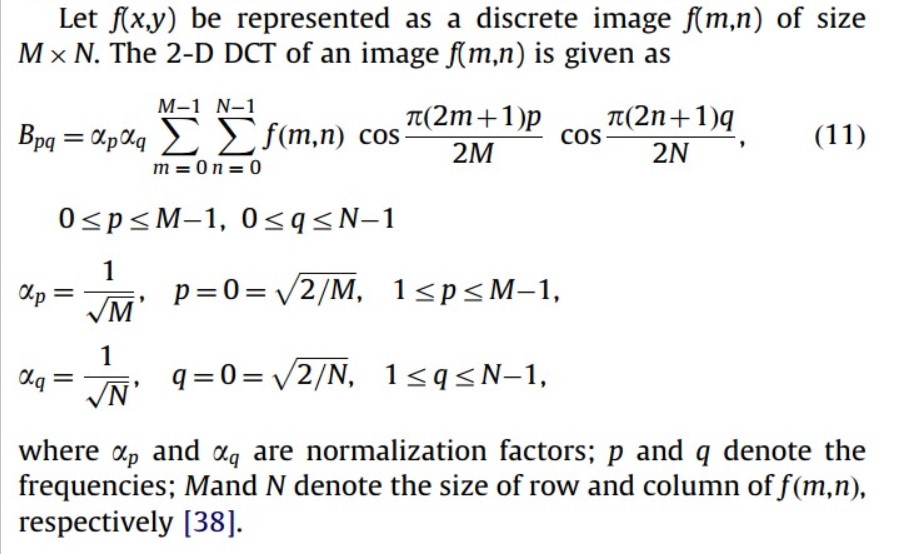
There is a significant improvement in the recognition rate as the use of DCT coefficients increases up to 30%. Any further increase in the coefficients does not improve the performance significantly. Hence we have selected 30% coefficients of DCT as significant coefficients in all the recognition. This happens because most of the information lies in the lower spectrum.
Experiments and Results
Code and dataset link
Code
Link for the codeDiscussion
Why Spectogram?
1. In speaker identification system, high dimension feature set is preferred to enhance the performance. However, increased feature dimension requires more computational time and storage space. The classifier using high dimension feature set also requires more parameters to characterize a speaker model, e.g. Gaussian Mixture Model (GMM). This increases computational complexity, making real-time implementation more difficult. Furthermore, a large amount of data is required for the training.
2.An alternative approach to this is to extract effective and efficient feature vectors.Mel frequency cepstral coefficients (MFCC) and linear prediction cepstral coefficients (LPCC) are the two most common feature extraction techniques in speaker identification. MFCC is generally used because of its robustness in speaker identification. Since the elements of feature vectors are generally correlated, a large number of mixtures with full covariance matrix are necessary to provide good approximation.
3.The GMM with diagonal covariance matrix is used for both speaker identification and verification because of its computational simplicity.
4.Contextual variations in speech are better represented using a spectrogram and hence it is widely used as a tool for speech analysis
5.A spectrogram is a graphical display of the squared magnitude of the time-varying spectral characteristics of speech. It is compact and efficient in representation carrying information about energy, pitch, fundamental frequency,formants and timing. Spectrogram reading techniques have revealed that a speech spectrogram contains rich acoustic features that could be valuable in an automatic speech and speaker recognition system
6.The technique we use here formulates the speaker identification problem into pattern recognition of images and resolving it using machine learning tools. The technique uses Radon Projections of speech spectogram in different angles to derieve the speaker's voice pattern. And to get more efficient and effective speaker features we use DCT (Dicrete Cosine Transform). As our dataset was small enough we did not use the DCT in our project.
Why Radon Transform?1. Radon transform is based on the parameterization of lines and the evaluation of integrals of an image along these lines. Due to inherent properties of Radon transform, it is a useful tool to capture the directional features of an image.
2. Basically, the Radon transform adds up the pixel intensity values in the given image (spectrogram) or time frequency distribution along a straight line in a particular direction at a specific displacement.
3. The spectrogram represents acoustic features like energy, pitch, fundamental frequency, formants and time in the form of a pattern.The Radon transform effectively captures these features in the pattern by projecting it onto different orientation slices.
4.The Radon projection is obtained by summing all the intensity values of those pixels that are within the circle surrounding the pattern to be recognized and on the line that is perpendicular to the ridge.Another advantage of using Radon transform in the proposed approach is its insensitivity to additive noise.
Why Discrete Cosine Transform?1. DCT is an orthogonal transformation that is very widely used in image compression and is widely accepted in the multimedia standards. DCT belongs to a family of 16 trigonometric transformations
2.DCT is used in signal and image processing as it has a strong "energy compaction" property for highly correlated data.
3. Can use FFT like algorithms to compute them in O(nlogn) time.
Results
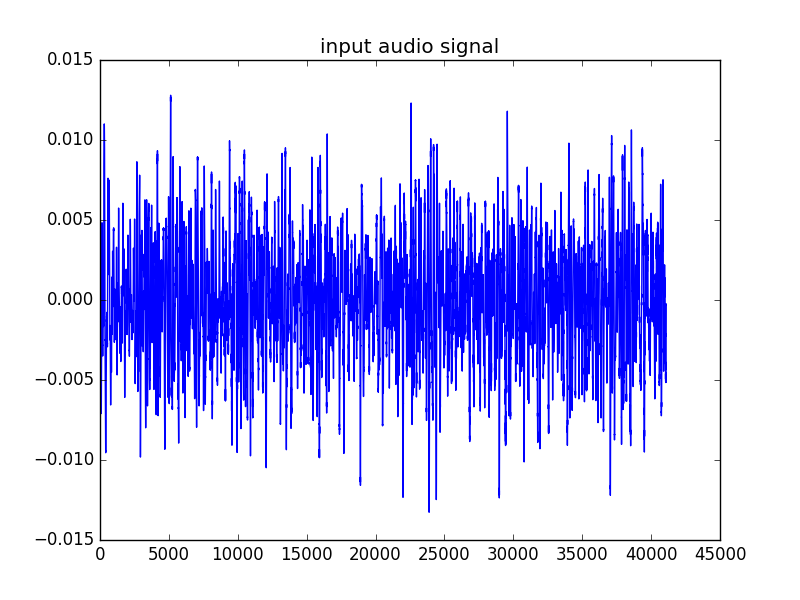
Voice Activity Signal / input signal
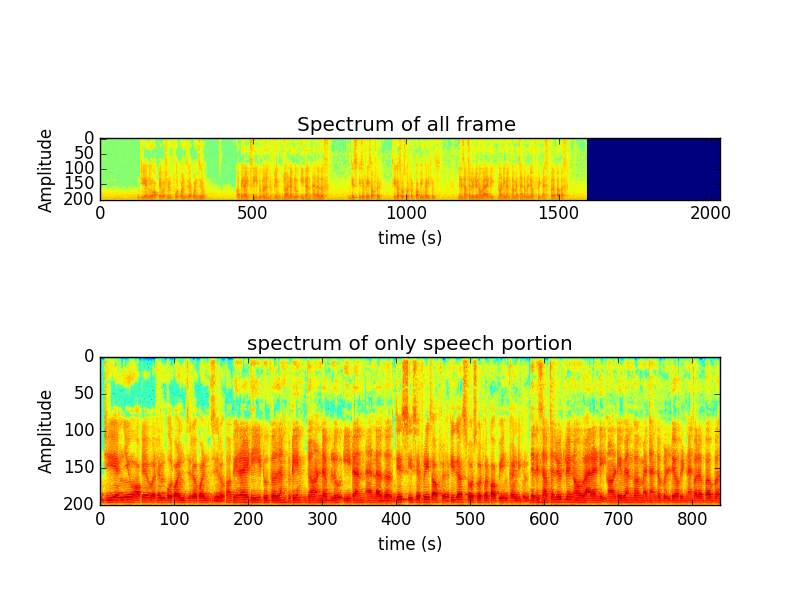
Spectrum of All frame and Spectrum of only speech portion after applying VAD
Correlation plot of features after taking the mean and deviation of features
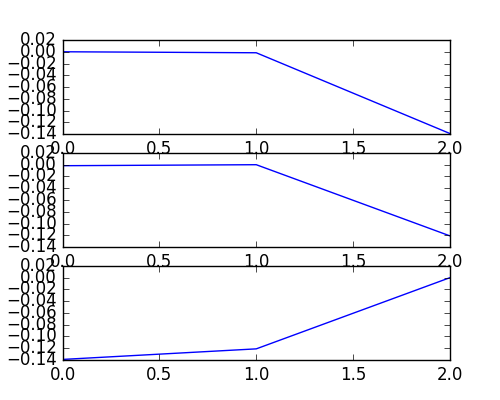
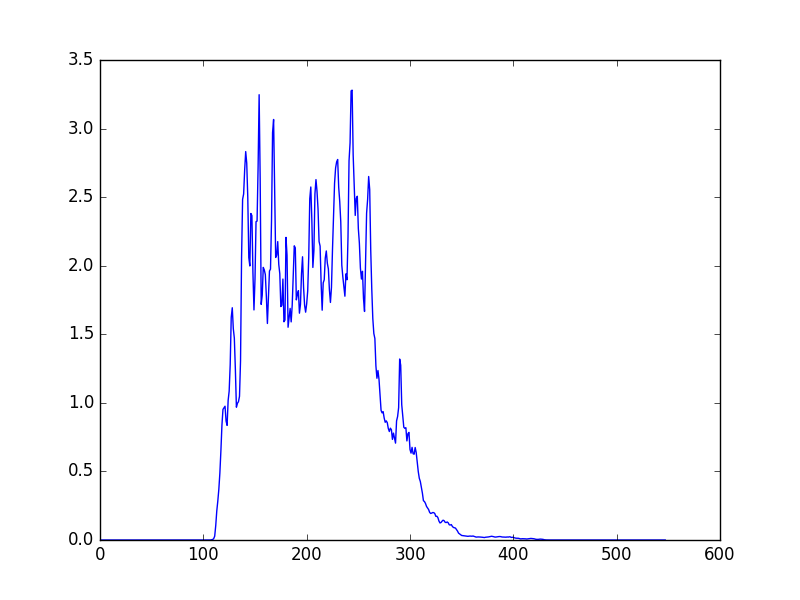
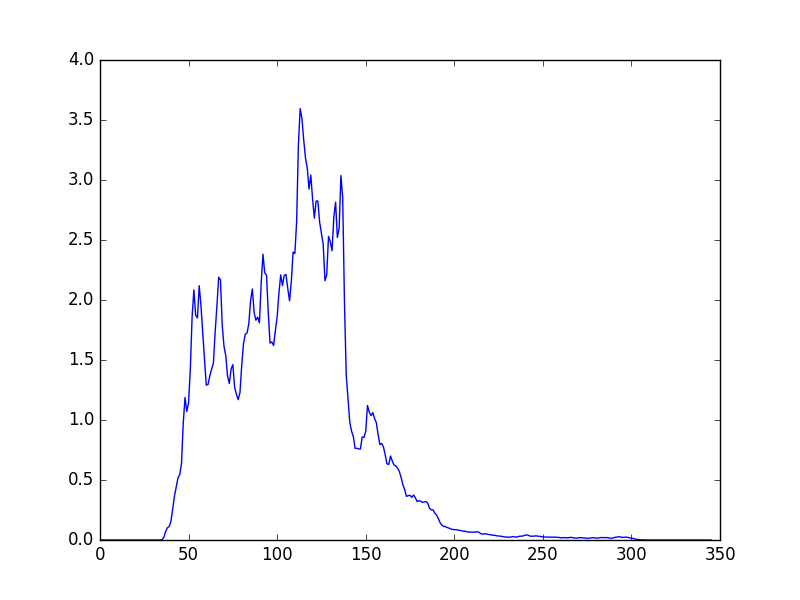
Plot of projection after taking the Radon projection of feature sptogram
Conclusion
We tried to identify speaker transitions using radon transform and DCT on speech spectogram. The results we got were unsatisfactory although the correlation matrix of DCT coefficents were more better in distingusihing two speakers than the correlation matrix of only Radon Transform Projections. The accuracy we got in detecting speaker transition was less than 50%. Hence we don't recommend using spectogram for speaker transition or identification tasks.
Future Extension
1.The noise robustness can be improved.
2. Furthermore, advance speaker diarization should be able to handle presence of overlapped speech on which the occurrence of overlapping speech almost regularly presents in natural conversation.
Applications
One of the most important application will be in transcription of conversations. It can be used to crop the speech of a specific person of interest from a long audio clip which can be used as evidence in criminal cases.
Team Members


Deepak Kumar Vipul Kumar Vijay
Roll No: 150122012 Roll No: 150103076
Branch: CST Branch : Mechanical